
Infographics by CLDES
As systems and processes become more complex, it becomes increasingly challenging to communicate them clearly. This is where our infographics come in: they simplify even the most difficult content, making it more accessible and easier to understand at every level.
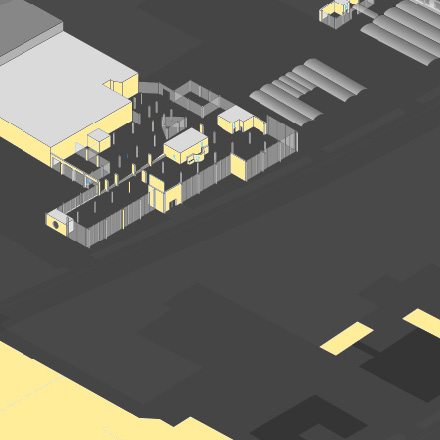
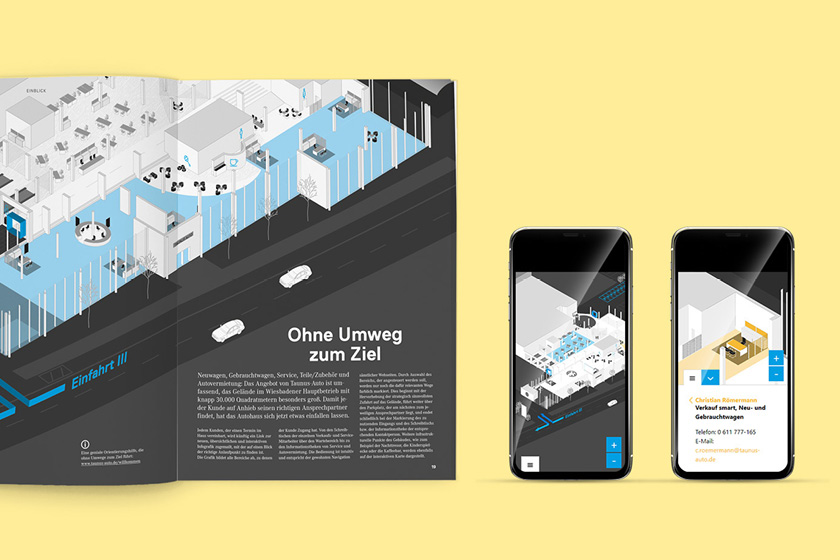
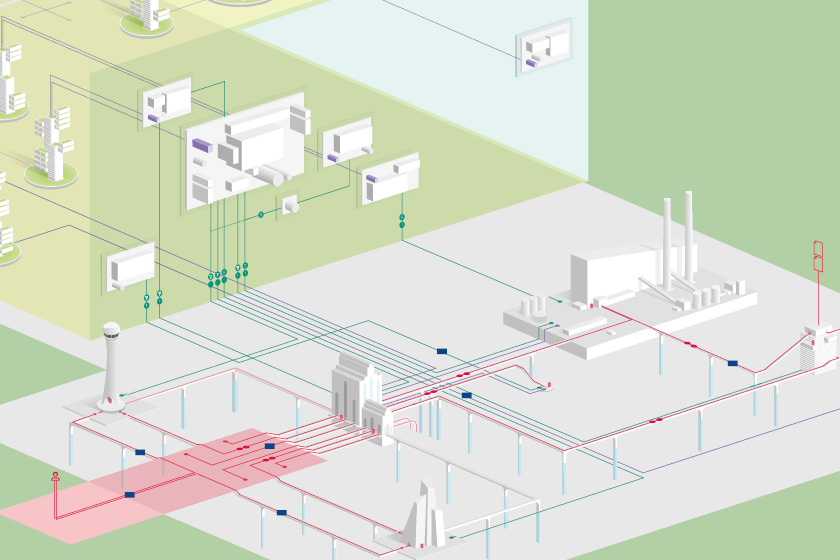
In close collaboration with our clients, we develop tailored, complex graphics in joint workshops. These graphics visualize IT systems, processes, or organizational charts in a clear and structured way, making even the most intricate topics easy to grasp. We place a strong emphasis on designing information that is precise, organized, and visually appealing to improve communication both within and outside the organization. Infographics are especially useful in change management communication, helping stakeholders better understand the changes.
Learn more about change management communication.
What Does an Infographic Do?
An infographic transforms complex data and relationships into easy-to-understand visual representations. It makes abstract information more tangible and simplifies the understanding of technical topics such as IT systems, processes, or statistics. A well-designed infographic organizes content clearly and concisely, enabling even complex subjects to be quickly understood. It aids in communicating complicated messages more effectively—both internally and externally—and enhances understanding and decision-making processes.
Approach
The basic requirement for our work is an
understanding of the structures and contents,
in order to define the visual language on the
one hand, and to prepare it for the most diverse
target groups on the other. We take constant
changes and extensions of the systems into
account right from the beginning of the concept
stage. Therefore, the graphics grow over time
with the displayed structures.
What Types of Infographics Are There?
Data Visualization:
Data visualizations present large datasets in easy-to-understand charts, graphs, or diagrams. They simplify comparisons and help identify trends and patterns quickly.
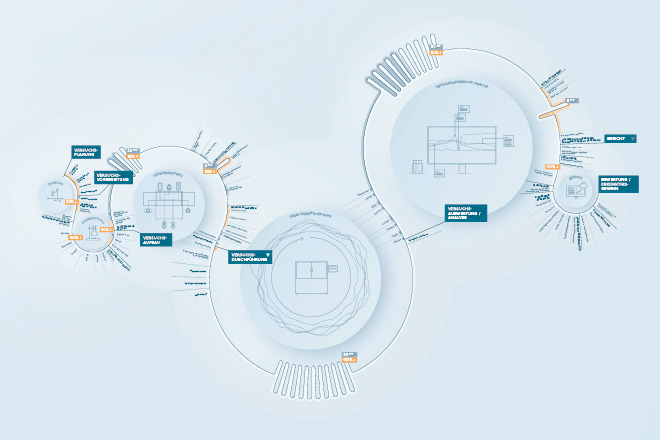
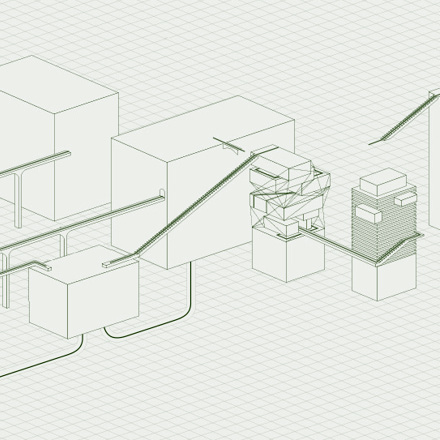
Process Graphics:
These infographics illustrate workflows and processes in clear, step-by-step formats. They are ideal for explaining production chains, business operations, or IT systems.
Organizational Charts:
Organizational charts provide a clear representation of hierarchies and structures within companies or institutions.
Illustrative Infographics:
Creatively designed graphics that explain complex topics through engaging illustrations.